Electrical Measurement of Captured Carbon Dioxide

Part I: Motivation

In developing any new system for capturing carbon dioxide, we want to know how well the system is working. Cyan captures carbon dioxide through a reaction with powdered calcium hydroxide sorbent (input material) to produce calcium carbonate, as shown:

                Ca(OH)2 + CO2  ---->  CaCO3 + H2O

The output material from a classic Cyan box is a crumbly mixture of both solids, plus residual water. If we can determine the amount of CaCO3 that is in the output material, we can calculate the amount of captured CO2 using standard Chem 101 techniques.

A weighing technique is used with the original Cyan, as developed by Dahl Winters (https://www.openairforum.org/t/cyan-project-progress/105). It assumes the output consists of a mixture of CaCO3 with remaining unreacted Ca(OH)2 . From the increase in weight, the amount of captured CO2 can be computed. This method requires great care in weighing the input and output material; weight of the coffee filter must be accounted for; there must be no loss or spillage of the material; it is essential that the output material be completely dry before weighing. Unavoidable errors can come from impurities in the input material or the water used for moistening it. But with proper care, we can assume reasonable accuracy, and encouraging reports of the original Cyan’s effectiveness have been given.

With other potential Cyan architectures, however, it can be difficult to recover all of the output material, making an accurate result from the weighing method infeasible.

We would like to have an alternative measurement available as a confirmation of the results from the weighing method. The gold standard would be a careful quantitative analysis procedure in a chemistry lab, but few people have the necessary equipment and supplies.

I propose here a method where a sample of the output is weighed out and added to distilled water. Then the CaCO3, being insoluble, will sink to the bottom and the remaining Ca(OH)2 will dissolve (up to its solubility limit). Since Ca(OH)2 is a strong base and fully ionizes in solution, a measurement of the electrical conductivity (EC) of this solution with an appropriately calibrated sensor should make it possible to determine the concentration of Ca(OH)2 remaining in the sample. From this, we can find the proportion of CaCO3 in the output material, thence the amount of CO2 captured. This is similar to a method published here (Burns, 2005) and also used in my earlier Aqueous Cyan experiments.

Scientific-grade EC meters are expensive. I will show how one can build a sensor that is adequate for our purposes, consisting of only a processor such as an Arduino, and a few other inexpensive items. This new design improves on my earlier one. Further details of the method will follow in a later post.

Part II: Building a Conductivity Meter

In this post, I describe how to build an inexpensive meter to measure the electrical conductivity (EC) of a solution. The intent is to provide enough instructions so that you can build one, too.

For background, you might want to read the following articles:

The key point to note is that you can’t measure EC in an ionized solution with a conventional ohmmeter. The test probes, having a positive and a negative terminal, will cause the ions to drift, resulting in electrolysis and a change in the conductivity of the solution to be measured. One workaround is to put a pulsed voltage on one electrode, making the measurement quickly before turning off the electrode.

The tester that I built for Cyan is inspired by the “Three Dollar EC Meter” described here: Three Dollar EC - PPM Meter [Arduino]. I added a few refinements to improve the accuracy; however this scheme omits the temperature probe and compensation. It’s assumed that measurements will be done at a relatively constant room temperature. A similar meter was used in my earlier Aqueous Cyan experiments.

This tester requires a microcontroller with analog inputs. I used an Adafruit Feather M0 Basic, which contains a SAMD21 ARM M0 processor; an Arduino or similar would work just as well with modifications. Here is the test circuit:

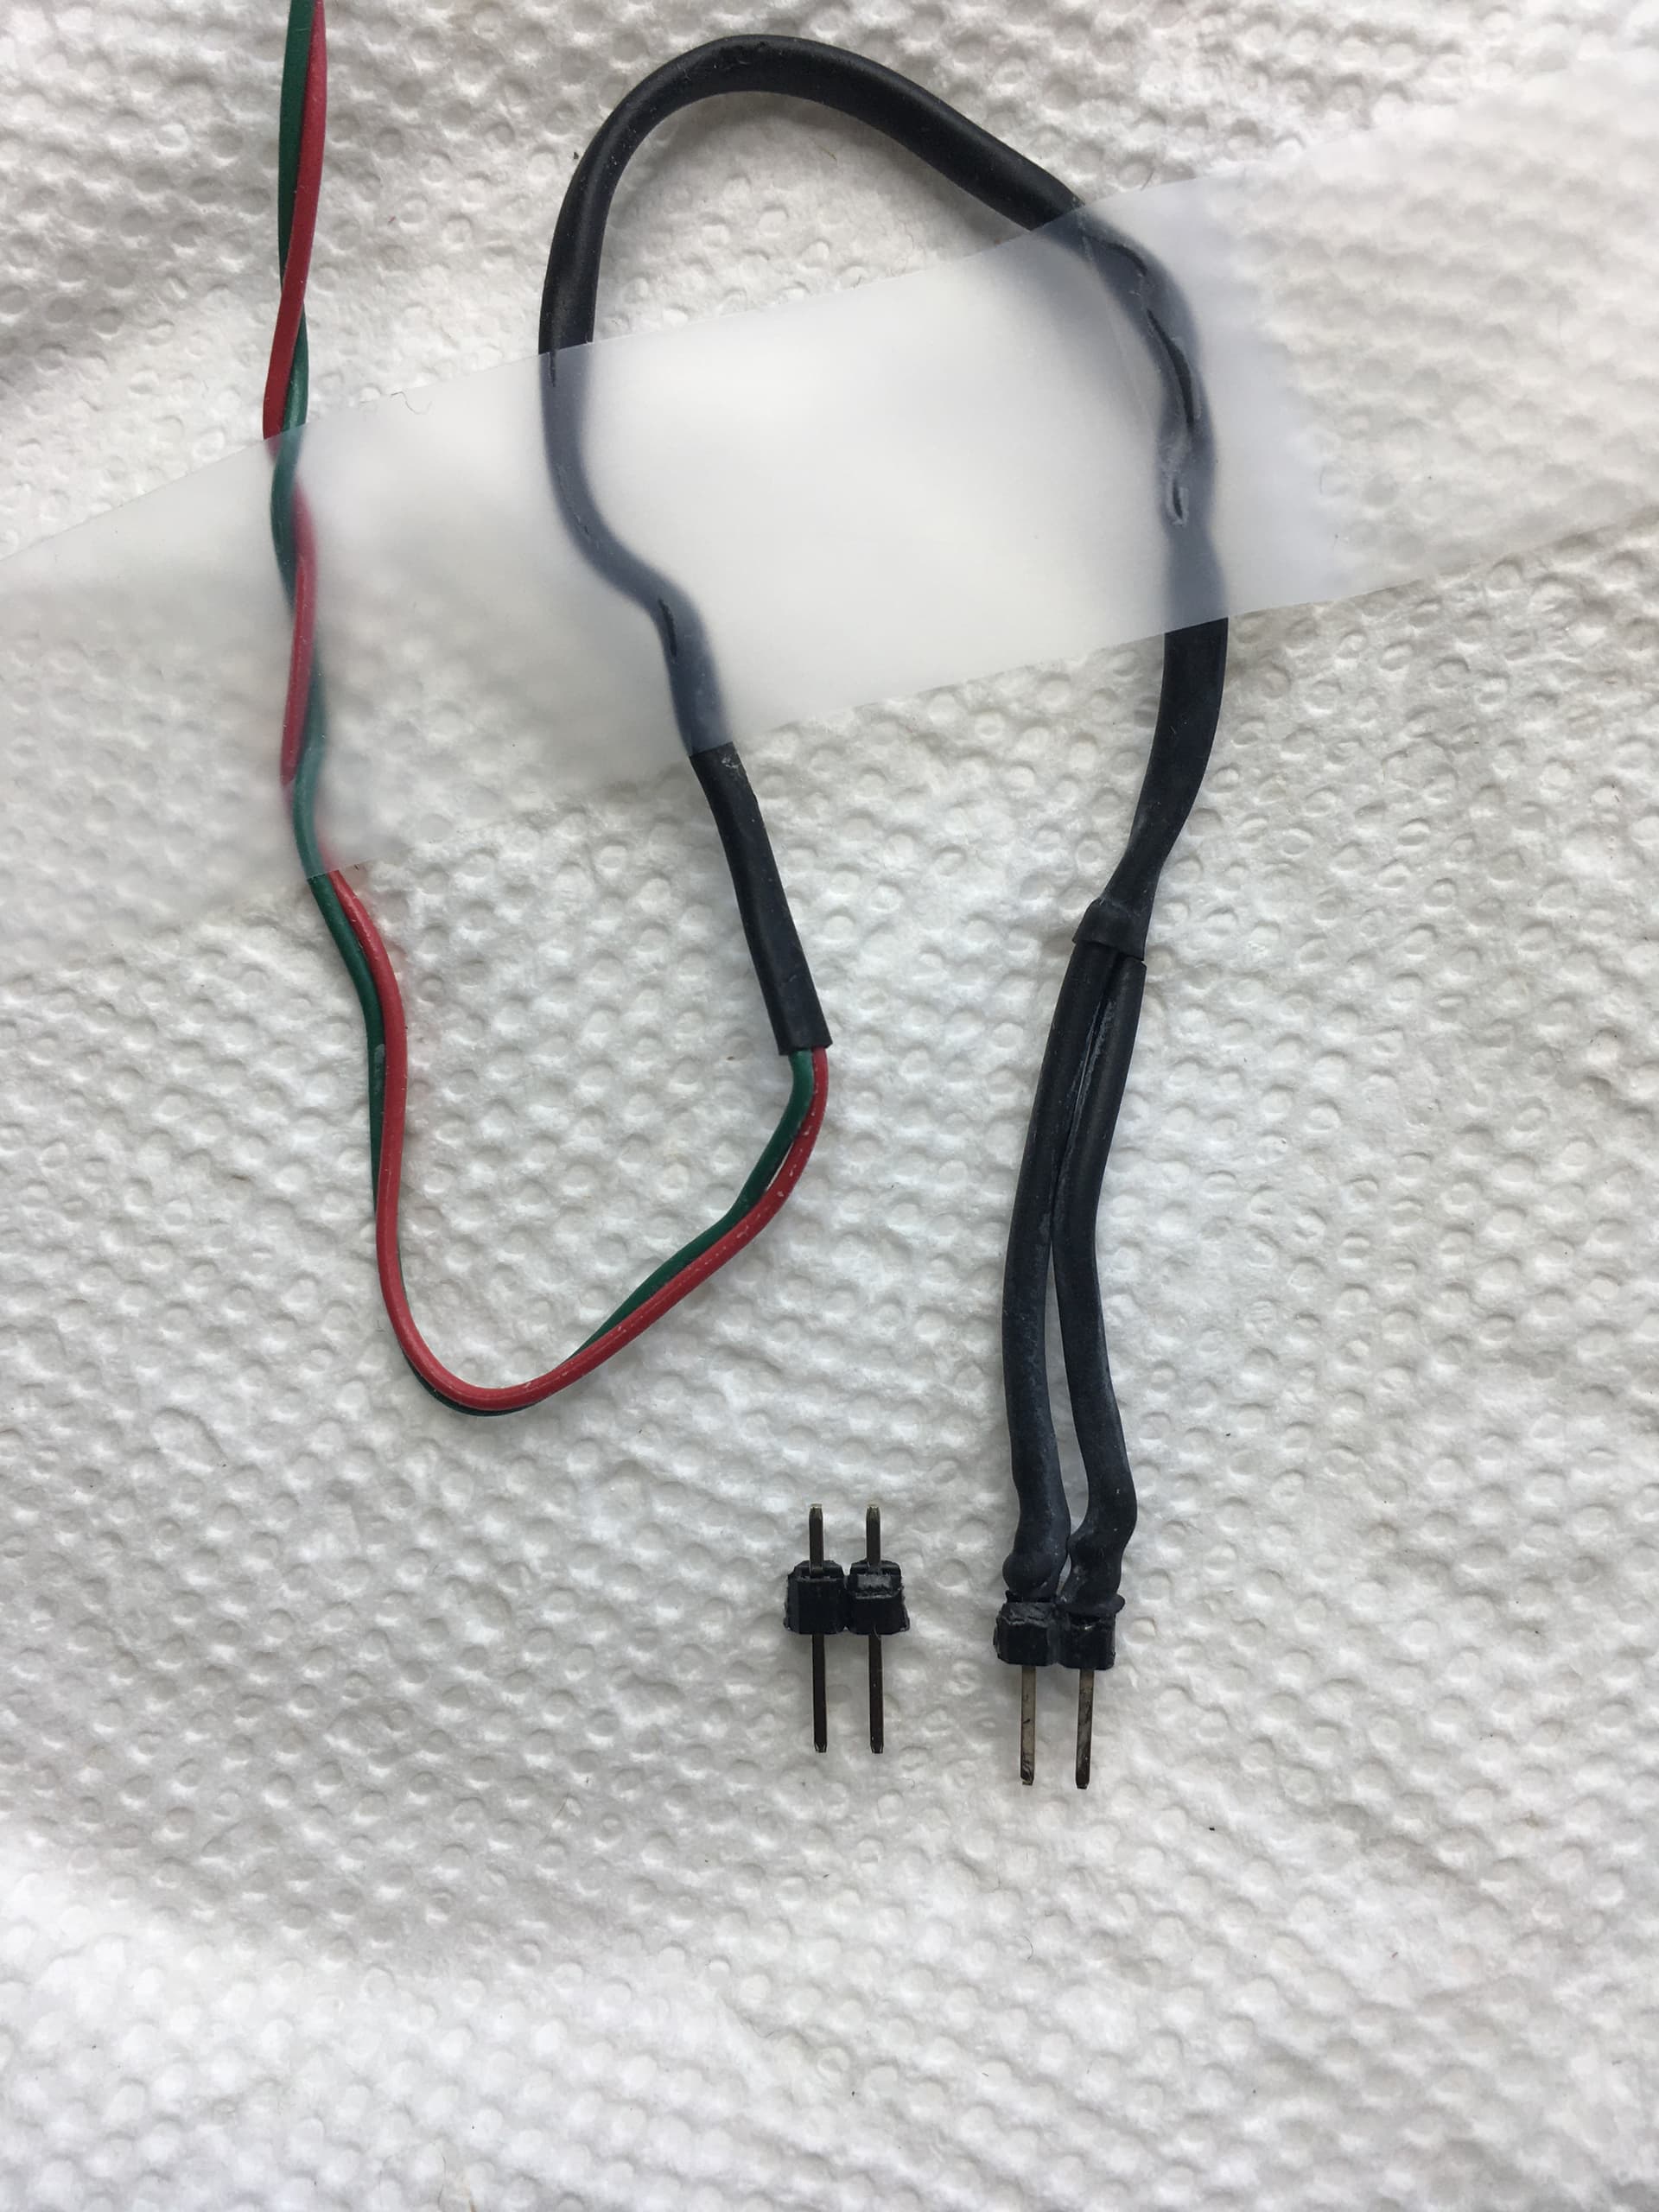
My probe was built by simply soldering wires to a 2-pin through-hole header; heat-shrink tubing is important for insulation and strain relief. Many other designs are possible depending on what you have on hand. Here is a picture of the completed device.


Resistor R1 is a known value that can be modified according to measurement needs. R2 represents the unknown resistance that we want to measure between the electrodes of the probe. The outputs labelled V1 and V2 are alternately pulsed HIGH, and an analog measurement is taken on V1, V2, and Vout. The program leaves both outputs LOW for 10 msec between measurements. The value of R2, is calculated from
image

The final step is to compute the EC in units of microSiemens (uS) / cm, with

EC = k / R2

where the calibration constant k depends on the geometry of the individual probe and must be experimentally determined. The complete program is available on Github here:

https://github.com/openair-collective/openair-cyan/blob/main/Conductivity%20Measurement/CyanConductivityMeasure_Ver1.ino

To determine k, I mixed up a saturated solution of Ca(OH)2 in distilled water and adjusted k in the source code to make results match published data ( Burns, 2005, and others).

As a proof of concept, I mixed several solutions of Ca(OH)2 with varying concentrations and measured the EC with this setup. Results are shown here:

The pink line labelled “Saturation” indicates the maximum amount of Ca(OH)2 that can be dissolved at room temperature; any additional Ca(OH)2 added after this point will not dissolve, and results will level off at about 8000 uS/cm. The near-linear characteristic below saturation is a promising indication for this scheme.

1 Like

Validating the electrical conductivity measurement for estimating captured CO2

As a proof of concept for the electrical conductivity (EC) method for analyzing a Cyan output, I asked Edward Kelley to send me processed material from his setup. I received seven batches of output material from runs of varying duration. These batches were shipped in separate zip-lock bags, and each contained white powder weighing just over 10g net. These contents are assumed to consist of a mixture of Ca(OH)2 and CaCO3, and the goal of the EC method is to determine the proportion of each; from that, we can calculate the total CO2 captured in the Cyan run for each batch.

I used an improved version of the EC meter which I will document in more detail in a later posting. This new meter reduces some sources of error with the earlier version. It is enough to say now that the response of EC vs. Ca(OH)2 concentration is very linear up to at least 1.0g per L of H2O, which means we can use a simple ratio of measured EC to determine the Ca(OH) molarity.
image

The measurement proceeded as follows: I used two jars, labeled “calibration” and “unknown,” each containing 250mL of distilled H2O. In the calibration jar, I dissolved 250 mg of Ca(OH)2. To the unknown jar, I added 250 mg of the sample under test and shook vigorously. As expected, some of the material, the insoluble portion consisting of CaCO3, settled to the bottom. The solution in this jar is then assumed to contain an unknown concentration of dissolved Ca(OH)2.

We are now ready for the measurement. I measured the EC of both the calibration solution and the unknown solution. From the ratio of the two measurments, the relative proportions of Ca(OH)2 and CaCO3 in the unknown sample can be determined. Assuming the sample is a fair representation of the entire batch output, and knowing the original weight of the Ca(OH)2 that went into the Cyan, I could then calculate the amount of CO2 that was captured (the equations are ugly but I’ll provide them in a later post).

At this point, Ed sent me his data on the output weights of each batch. Recall that we can also find the CO2 captured by knowing the starting and finishing weights (see explanation here).

Results

The spreadsheet shown here collects all the data. The results of the conductivity method and the weighing method are shown in colored columns.

It is useful to display the results from each batch in a scatter plot, with the axes representing the results from the two methods. The diagonal blue line represents equal results.

We can see that 4 points fall close enough to the center line to be within the expected error. For two other batches, the EC method result is significantly lower, and in one batch, it is much higher.

I will discuss possible explanations for the inaccuracy seen in a later post, and investigate improvements that might be made.

Equation for CO2 captured in EC method

Here, as promised, is the equation for calculating the weight of captured carbon dioxide from EC measurements:

image

Where W(CO2) is the weight of captured CO2 in g; M(CO2), M(CaCO3), and M(Ca(OH)2) are the molecular weight in g/mol of carbon dioxide, calcium carbonate, and calcium hydroxide, respectively; Wt is the initial weight of the Ca(OH)2 put into the Cyan system; Ws(cal) is the weight of Ca(OH)2 dissolved in the calibration solution jar, and Ws(unk) is the weight of Cyan output material added to the unknown solution jar, both in g; finally, C(cal) and C(unk) are the electrical conductivity of the calibration and unknown solutions, respectively, in uS/cm.

Observations of inaccuracy and drift in EC measurement

In order to get to the cause of the inaccuracy of some of the measurements above, I decided to focus on batch D3, where the electrical conductivity (EC) test result for CO2 capture weight was far above that from the output batch weighing method. While running the first set of tests, I had made a couple of observations that seemed relevant.

First, the powdery material that I received in the zip-lock bags varied in its consistency among the batches. In particular, Batch D3 looked lumpier than the others. I had attempted to smash the lumps before running the first tests, but may not have been diligent enough. These lumps may indicate that the batch is not homogeneous, and so a given 250-mg sample taken for the testing may not be representative of the entire batch—it could have either an excess or a deficit of unprocessed Ca(OH)2, which would throw the measurement off.

Second, I have noticed in a number of the recent tests that the EC tends to rise over time after adding and mixing the sample material to the water. I am not sure why this happens; but one theory that would explain the error seen is the formation of micro-granules during the Cyan mineralization process with Ca(OH)2 encapsulated within a shell of insoluble CaCO3. This would reduce the concentration of Ca(OH)2 in solution, which results in an over-estimate of CO2 captured. Perhaps these microgranules eventually soften after soaking in water, and gradually release the trapped Ca(OH)2.

In order to examine these notions, I ran a retest of Batch D3. This time I made an extra effort to grind and mix the contents of the bag; then I let the unknown solution sit for three days, taking periodic EC measurements to check the variation. The results are plotted here:
image

As predicted, the EC rose over time; unexpectedly, it fell again after about 24 hours and kept drifting downward, but not quite back to the initial level. The reason for this needs to be researched in further work. It is known that EC varies with temperature, so that is one avenue to explore.

Interestingly, the EC of the pure Ca(OH)2 calibration solution, which is the same one that I made up at the start of this testing, has also drifted upward and downward over time. It is important when running this test to always measure both solutions for each data point.

Based on the updated EC data, I added three more data points for Batch D3 to the spreadsheet using measurements taken over different soak times. Note also the variation in the calibration EC.

And here I show the scatter plot from before, updated to show the new data, with the old value for D3 circled in red, and the new values circled in green.

Conclusion: waiting for a day or so before measuring the EC seems to improve the match between the EC method and the weighing method, but more investigation is needed.

New Design for Conductivity Meter: Balanced Polarity and Dual Probes

Here is a new design that I have been using for the latest measurements. First, I changed the topology of the circuit so the connections between each source terminal and the probe (and solution under test) are symmetrical; the resistors R1 are now found on both sides of the probe. By alternating the operation of V1 and V2 so that one is HIGH (VCC) when the other is LOW (GND), and vice-versa, the average voltage across the probe (DC value) stays at zero. This prevents electrolysis of the solution which leads to an inaccurate measurement. Note that each Source (output) pin has an associated Sense (analog input) pin. This is to measure the exact voltage across the measurement circuitry, which may be offset from that of the Source outputs. R2 represents the resistance of the solution, in ohms, referenced to the terminals of the associated probe.

I have also provided two probes to allow measuring two solutions (nearly) simultaneously (see the 4/16/22 post, above, for a picture of one probe). Since there are only six analog inputs available on the Feather M0, the V1 and V2 sense inputs must be shared between the probes. As long as the probes have their own separate inputs Va and Vb, this does not create a problem.

I also increased the analog read resolution to 12 bits from 10, and changed the R1 values to broaden the accurate measurement range.

To calculate the resistance of the solution from the measurements, let

image

and

image

Then

image

The final step is to compute the EC in units of microSiemens (uS) / cm, with

EC = k / R2

where the calibration constant k depends on the geometry of the individual probe and must be experimentally determined.

The source code that goes with this hardware design is here:openair-cyan/CyanConductivityMeasure_Ver3.ino at dev · openair-collective/openair-cyan · GitHub

Electrical Conductivity Testing: Bumps in the Road (Pt. 1)

I’m continuing to look at test accuracy, following up on the issues I brought up in testing Edward’s samples (see above). I want to understand the cause and nature of the drift observed in EC values, which result in uncertainty in the results for CO2 capture.

I made up four different test solutions, consisting of 62, 126, 186, and 250 mg of Ca(OH)2 dissolved in 250 mL of distilled water. Each batch was made fresh instead of adding additional material to old solution. I then measured and recorded the EC at one-minute intervals over a period of several hours using the new meter design presented earlier. Results are shown here:
image

Note the drift in results over time. I hypothesized that this could be explained by the variation of EC with temperature, as my testing is done in a room with daily variations in temperature due to sunlight and air conditioning. To a linear approximation, the conductivity C(T) as a function of temperature can be given by

image

where image is the conductivity at 25 deg C, and image is the temperature coefficient, which for many electrolytes is of the order of 0.02/C (I have not been able to find a definitive figure for Ca(OH)2).

To test this hypothesis and measure the magnitude of the temperature influence, I got a pair of submersible temperature sensors and connected them to the Adafruit Feather processor in the existing setup. The part number is DS18B20, which uses a Dallas Semiconductor (now Maxim) One-Wire interface. This is the part: https://www.adafruit.com/product/381.

I then prepared two new Ca(OH)2 solutions, with 62 mg and 124 mg of material dissolved in 250 mL of distilled water. I measured the EC and the temperature of each solution at one-minute intervals for over 60 hours. During that time, I allowed the temperature of the room to vary by several degrees. At the end, I plotted the measured EC and the temperature:

image

image

Observations: looking at the overall shape of the traces, it’s clear that there is a (qualitative, at least) relationship between the EC and the temperature for both samples. In order to get a clearer picture of the relationship, I plotted the same data as a scatter plot, with EC plotted against temperature, and had Excel find the linear fit. I hoped to determine accurate values of image and image, so we could use a temperature offset to gain a more accurate measurement.

image

image

This is not the result I had expected! Theoretically, the points should have fallen in a straight line, with the slope indicating the value of the temperature coefficient. Note the low value of correlation coefficient r, especially for the 62 mg jar. As the temperature sweeps up and down, the EC never returns to its previous value, but follows a different, almost zig-zagging path. This appears to be either a time-varying value of EC, or a memory effect whereby changes in temperature alter the nature of the solution.

More investigation and discussion on this to come.

Electrical Conductivity Testing: Bumps in the Road (Pt. 2)

Let’s look again at the scatter plot for Jar 0, the one with 62 mg of Ca(OH)2 dissolved in it.

Expecting a static relation between the EC and the temperature, we instead find a path that meanders over time, with a general downward trend in the EC. The arrows indicate the direction of time.

This temporal decrease in the EC could be explained in a few ways. Assuming that the conductivity is proportional to the density of the ions in the solution, the first and most obvious explanation might be that the solution is reacting with CO2 in the atmosphere and precipitating out as CaCO3. This is unlikely to be a significant effect, as I have made sure to cover the jars with plastic wrap; the only CO2 contacting the solution is in the small volume of air in the jar, about 250 mL.

Another possibility is that the pins of the EC probes had become fouled, adding resistance and hence reducing the measured EC. So I removed the probes and cleaned them in vinegar and then water. I also gave both of the jars a good shake in case the concentration of dissolved Ca(OH)2 had somehow become uneven. I then put the probes back in the jars and restarted the testing.

The graph below shows a close-up of measured results for both solutions before and after the cleaning and shaking. The point at which this occurred is indicated with red arrows. We can see there is a small step up for the 124 mg solution, and a small step down for the other. I have seen this discontinuity before when shaking or stirring the solution, but the magnitude is too small to explain the larger downward trend. It also indicates that the probes were not the problem.

Finally, I swapped the probes between the two solutions, and found no significant difference in the results. I ran the test for over 96 hours out of curiosity to see what would happen. As before, both jars were sealed from any atmospheric influence. I did not artificially change the room temperature, so the diurnal temperature swings are smaller than in the last run. Results are shown in the graphs below:

A few features to note. After 66 hours, I gently stirred both jars. Jar 1 showed a drop in EC (indicated by red arrow), but there was no evident change to Jar 0.

After 94 hours, I removed and again cleaned both probes. I also gave both jars a good shake for 20 seconds or so. After that, the change was rather dramatic: the EC of Jar 0 dropped, and that of Jar 1 rose.

Due to the inconsistent and as-yet unexplained behavior seen in the preceding results, I am hesitant to state that the electrical conductivity method is “ready for prime time” if we expect accurate measurements of Ca(OH)2 content and CO2 capture in Cyan.

Note: in case I did not make it clear before, the reason this is important is that the EC measurement depends on the assumption that the conductivity is proportional to the amount (molarity) of dissolved Ca(OH)2. Doubling the concentration of Ca(OH)2 should exactly double the EC. Clearly, this is not the case for the results I have shown.

Some modifications that could be made that might improve the consistency of the results:

  1. Add a magnetic stirrer to keep the solution mixed.
  2. Replace the loose probes (photo near the top of this thread) with rigid terminals attached to the jar so that the measurement will always take place at the same location.

And some help that would greatly benefit this project:

  1. Someone needs to do an actual chemical analysis of the input and output Cyan material to use as a confirmation of measured results. This would benefit the entire Cyan effort!
  2. I would appreciate some insight from chemists about what is going on in these solutions.

Program: The latest program file, including the two One-Wire submersible temperature sensors as well as an optional DHT temperature-humidity sensor is located here: openair-cyan/CyanConductivity-Temperature_Ver5.ino at dev · openair-collective/openair-cyan · GitHub

Very brief note: I took a close look at my probe used in the above measurements, and it looks corroded. It definitely is not shiny like when it was new. This would explain the long-term drift towards lower conductivity seen.

The corrosion of electrodes in alkaline solutions is a known issue, which is why professional quality EC probes are made of materials such as platinum. I can’t afford platinum probes, so a possible workaround is simply to minimize the time the probe sits in the solution–dipping it in briefly to take a measurement instead of leaving it to soak for days at a time.